
How to Add a Trendline in Google Sheets
Learn how to add a trendline in Google Sheets to visualize trends and make predictions with your data.
By adding a trendline to your chart in Google Sheets, you may be able to better understand the overall direction and pattern of your data series. In this tutorial, we'll guide you through each step you need to follow to add a trendline in Google Sheets and provide you with tips for best practices.
How to add a trendline in Google Sheets
When creating a trendline in Google Sheets, you will follow these steps:
Open your Google Sheet.
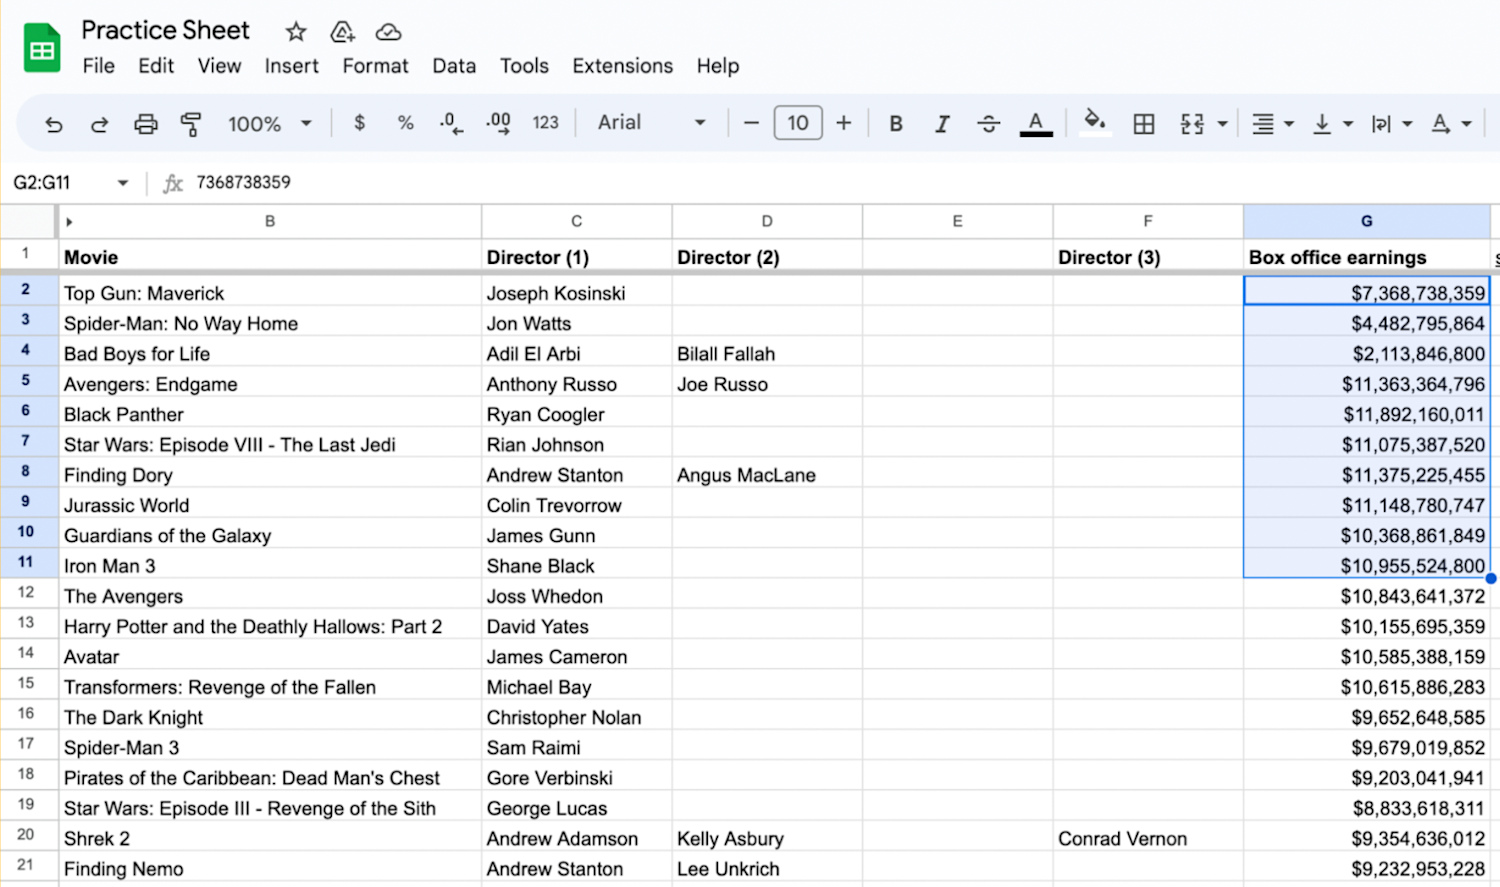
Highlight your data.
Go to Insert > Chart.
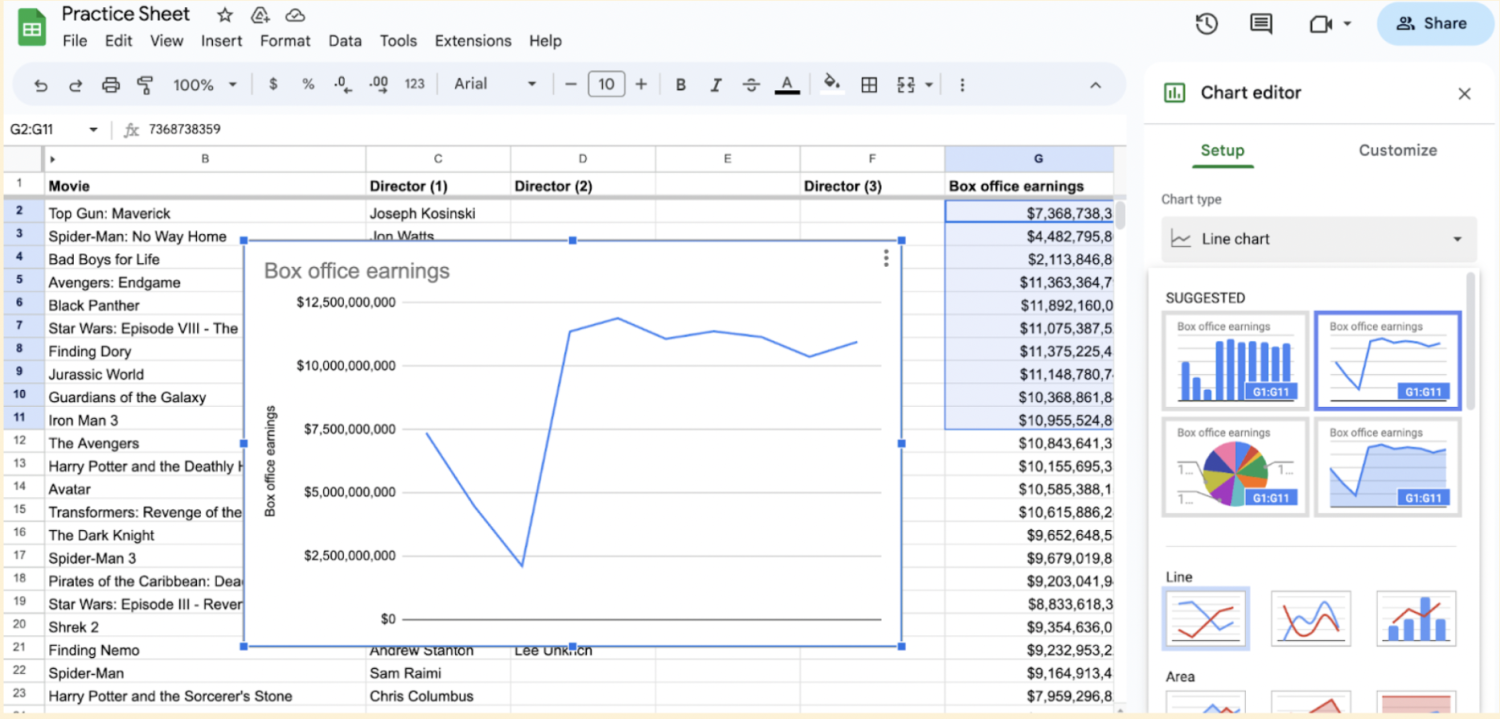
Choose a chart type.
Go to the chart editor and click Customize > Series.
Click on Trendline.
Now, let’s break down each step further, so you can utilize this tool with your data effectively.
1. Open Google Sheets.
Begin by opening Google Sheets in your web browser.
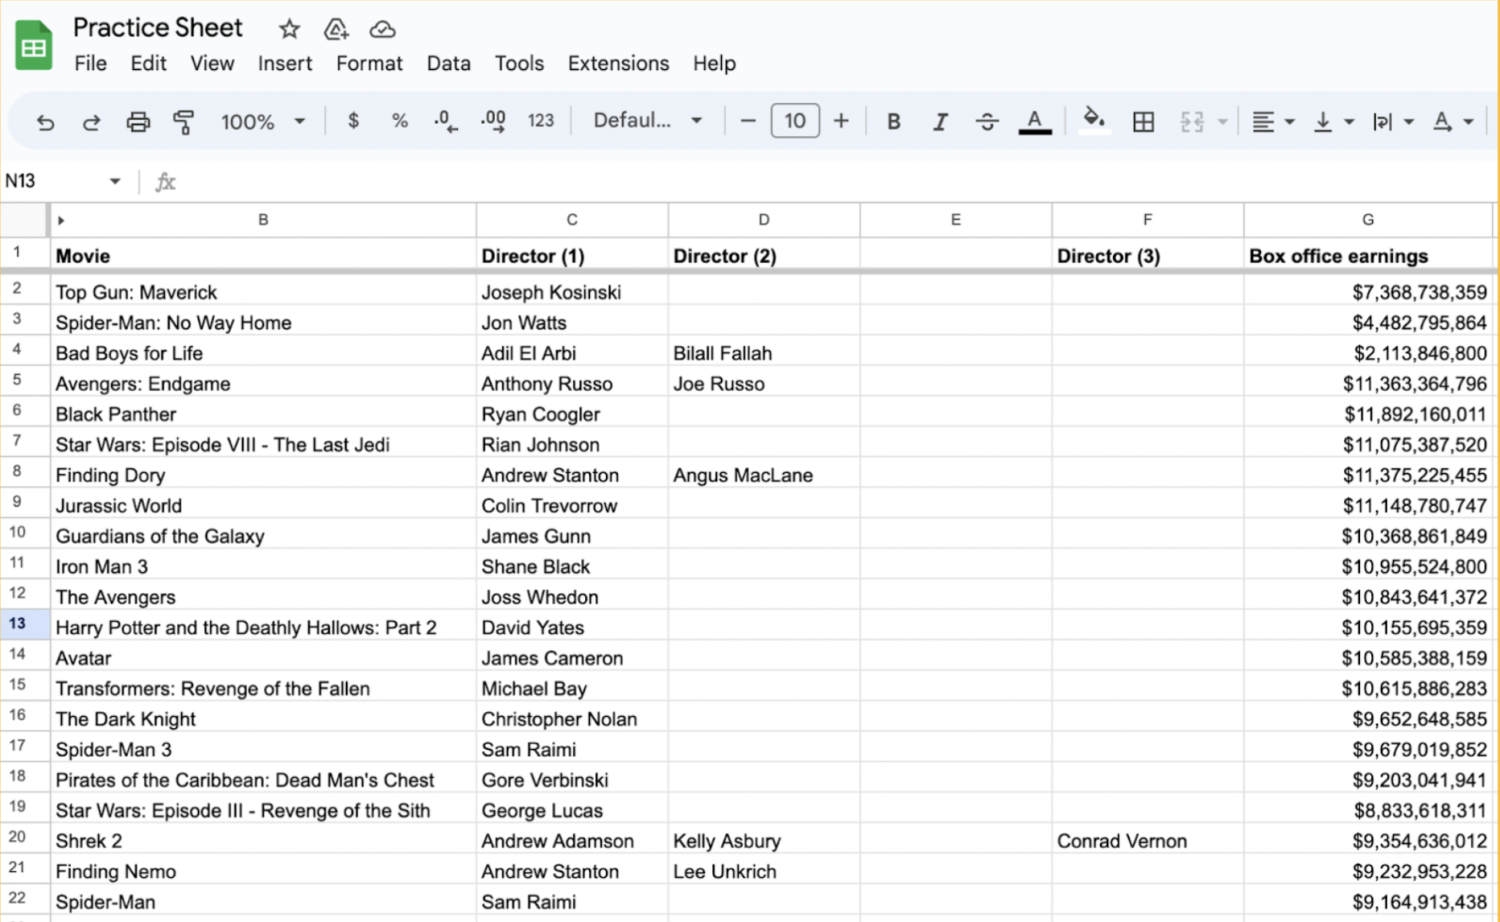
2. Select your data.
Select the data range that you want to include in your chart. Make sure you organize your data in columns or rows.
3. Go to the 'Insert' menu and select 'Chart.'
With your data selected, click on the Insert menu at the top and choose Chart.
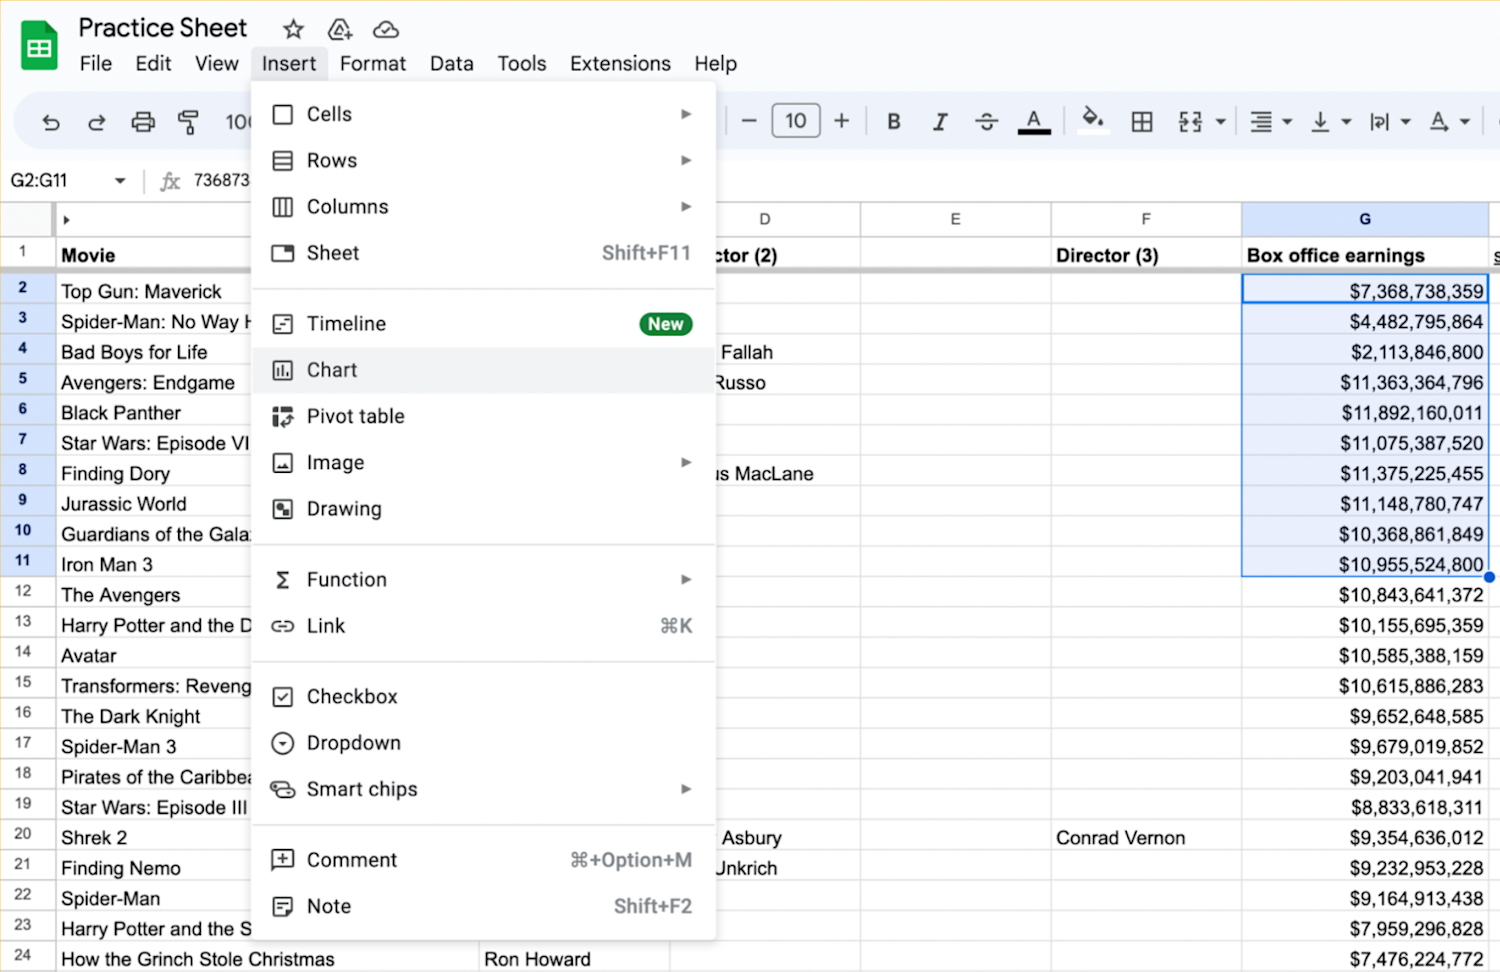
A new window will appear with various chart types to choose from.
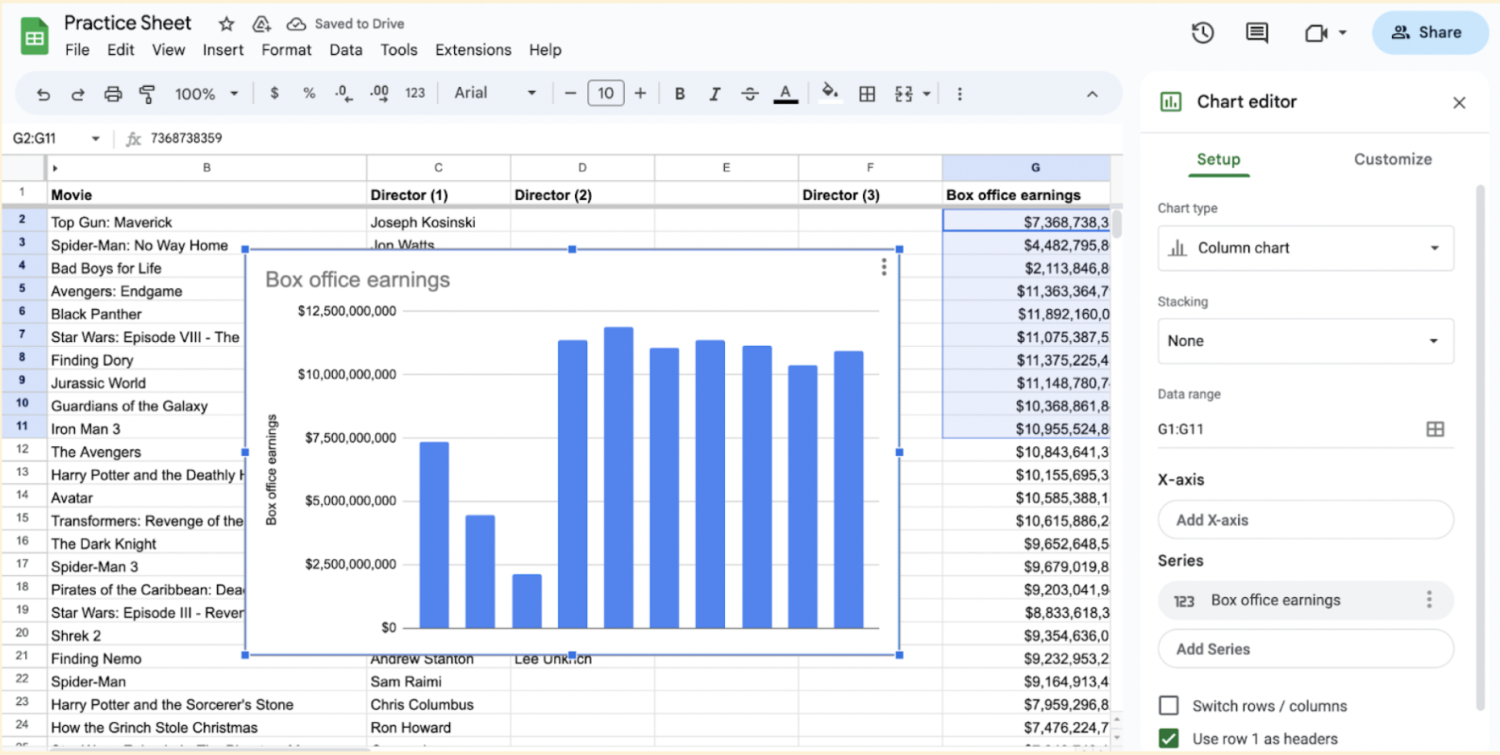
4. Select a chart type.
Select the chart type that best represents your data. Common choices for trendline analysis include scatter or line charts.
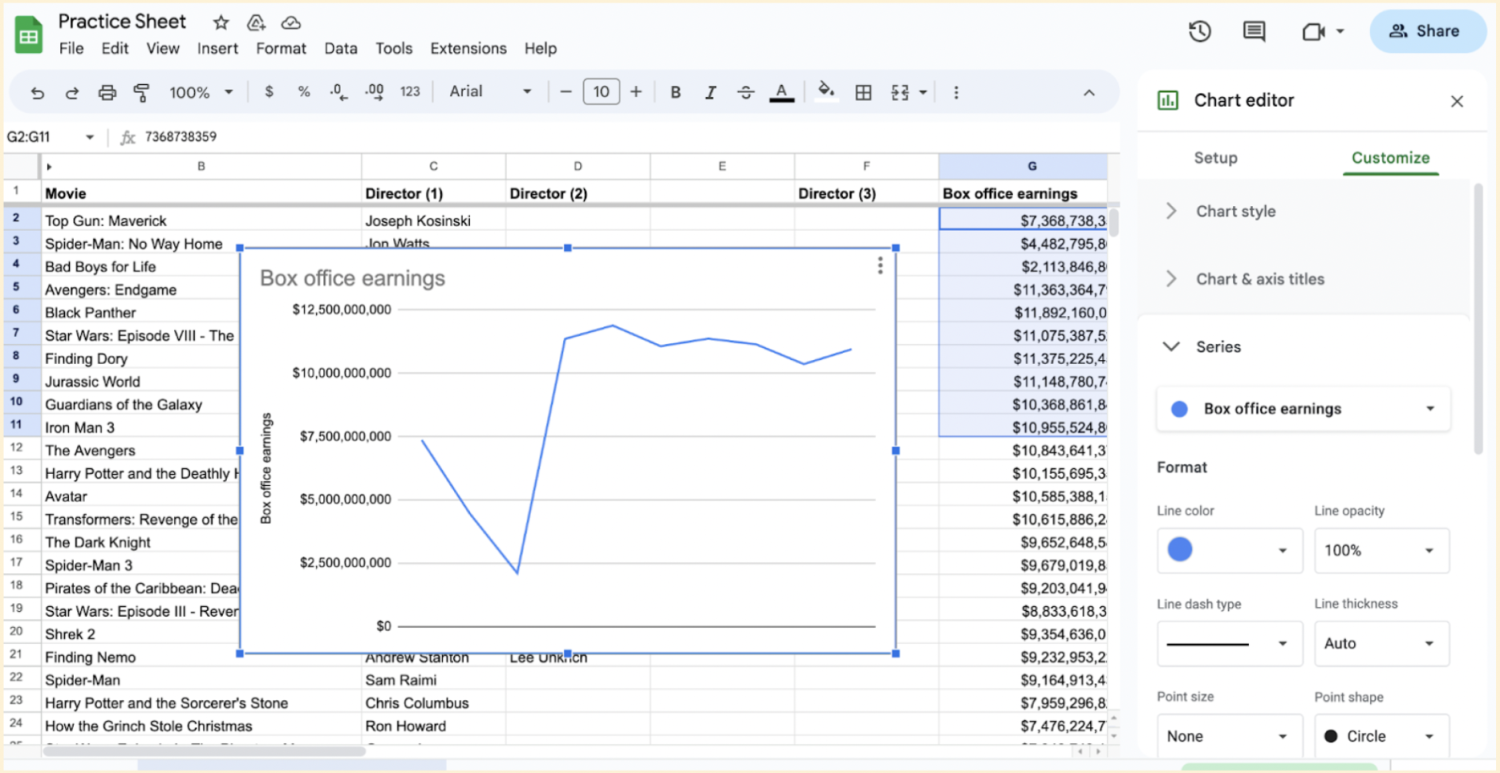
5. Go to the 'Customize' tab and select 'Series.'
Click on the chart to select it. In the chart editor, click on the Customize tab. Customize your chart as desired. You can change the chart title, axis labels, colors, and other formatting options using the options available in the chart editor.
Scroll down and click on Series.
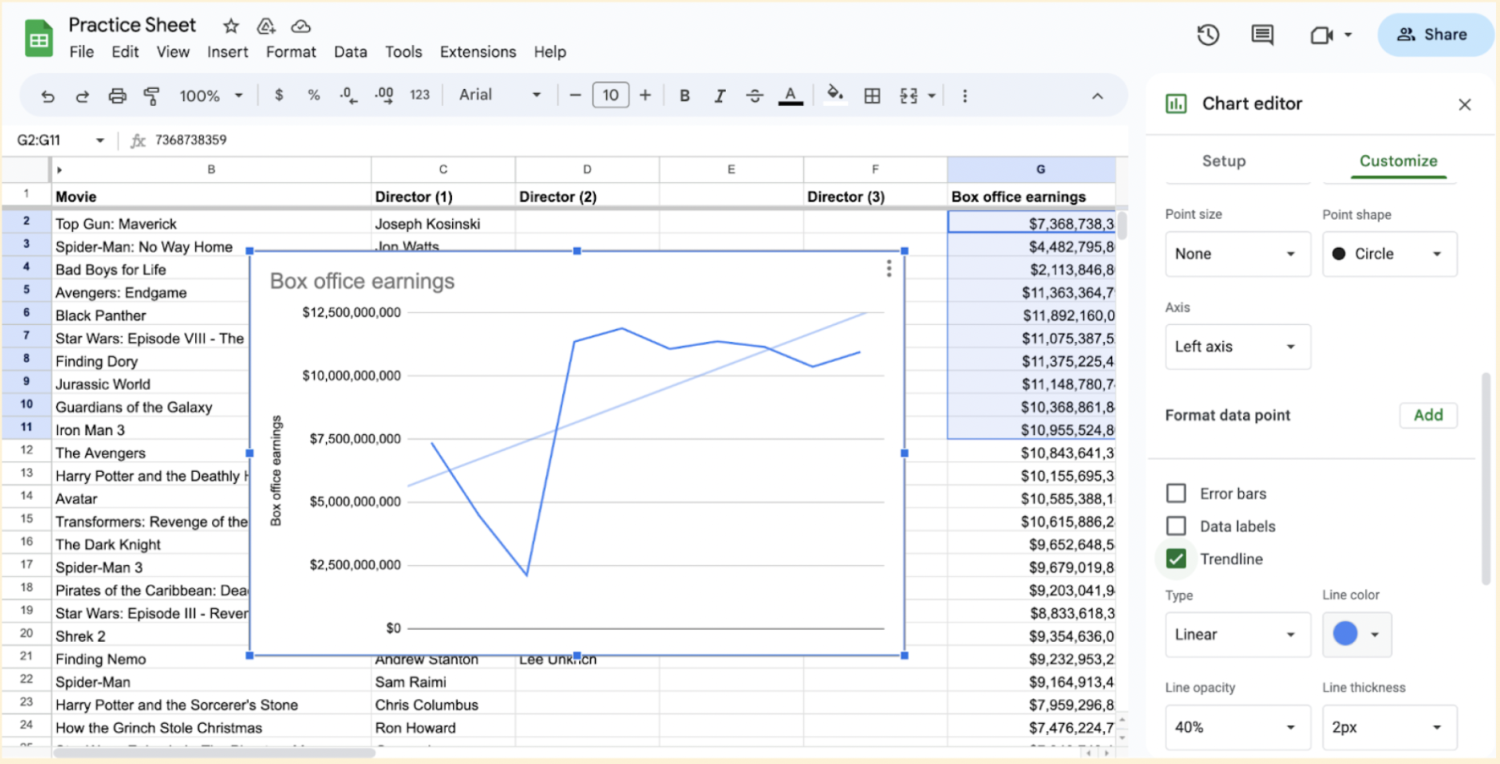
6. Add your trendline.
Tick the Trendline box at the bottom of the Series section.
Best practices with trendlines
When working with trendlines, consider these tips to make the most of your trendline chart.
Evaluate R-squared value: The R-squared value provides an indication of how well the trendline fits your data. A value close to 1 indicates a strong fit, while a value close to 0 suggests a weak fit. To find this number, check the Show R² box at the bottom of the Series section in the chart editor.
Update trendline with new data: If you add or modify data in your sheet, you should continue updating your trendline to reflect any new patterns.
Limitations of trendlines
One limitation of trendlines is that they need to be readjusted as more data is entered. While your trendline may represent the data you have, as new data becomes available, the current trendline may not reflect new information. It is important that you keep trendlines up to date to ensure you are using information that correctly reflects your data.
Treadlines based on highly variable data may also not accurately reflect true information. Trendlines based on more data with less variability will have higher validity on average. When deciding whether to use a trendline, you should consider what type of data you have and whether it can be accurately represented by this type of chart.
Learn more with Coursera
You can build your data visualization, management, and analysis skills with courses and Professional Certificates on Coursera. Consider enrolling in the Google Data Analytics Professional Certificate to learn in-demand skills such as data programming, working with Google Sheets, cloud computing, and more.
Keep reading
Coursera Staff
Editorial Team
Coursera’s editorial team is comprised of highly experienced professional editors, writers, and fact...
This content has been made available for informational purposes only. Learners are advised to conduct additional research to ensure that courses and other credentials pursued meet their personal, professional, and financial goals.